
Student Insights Suite
Live in productionAU · Melbourne · Business Analytics
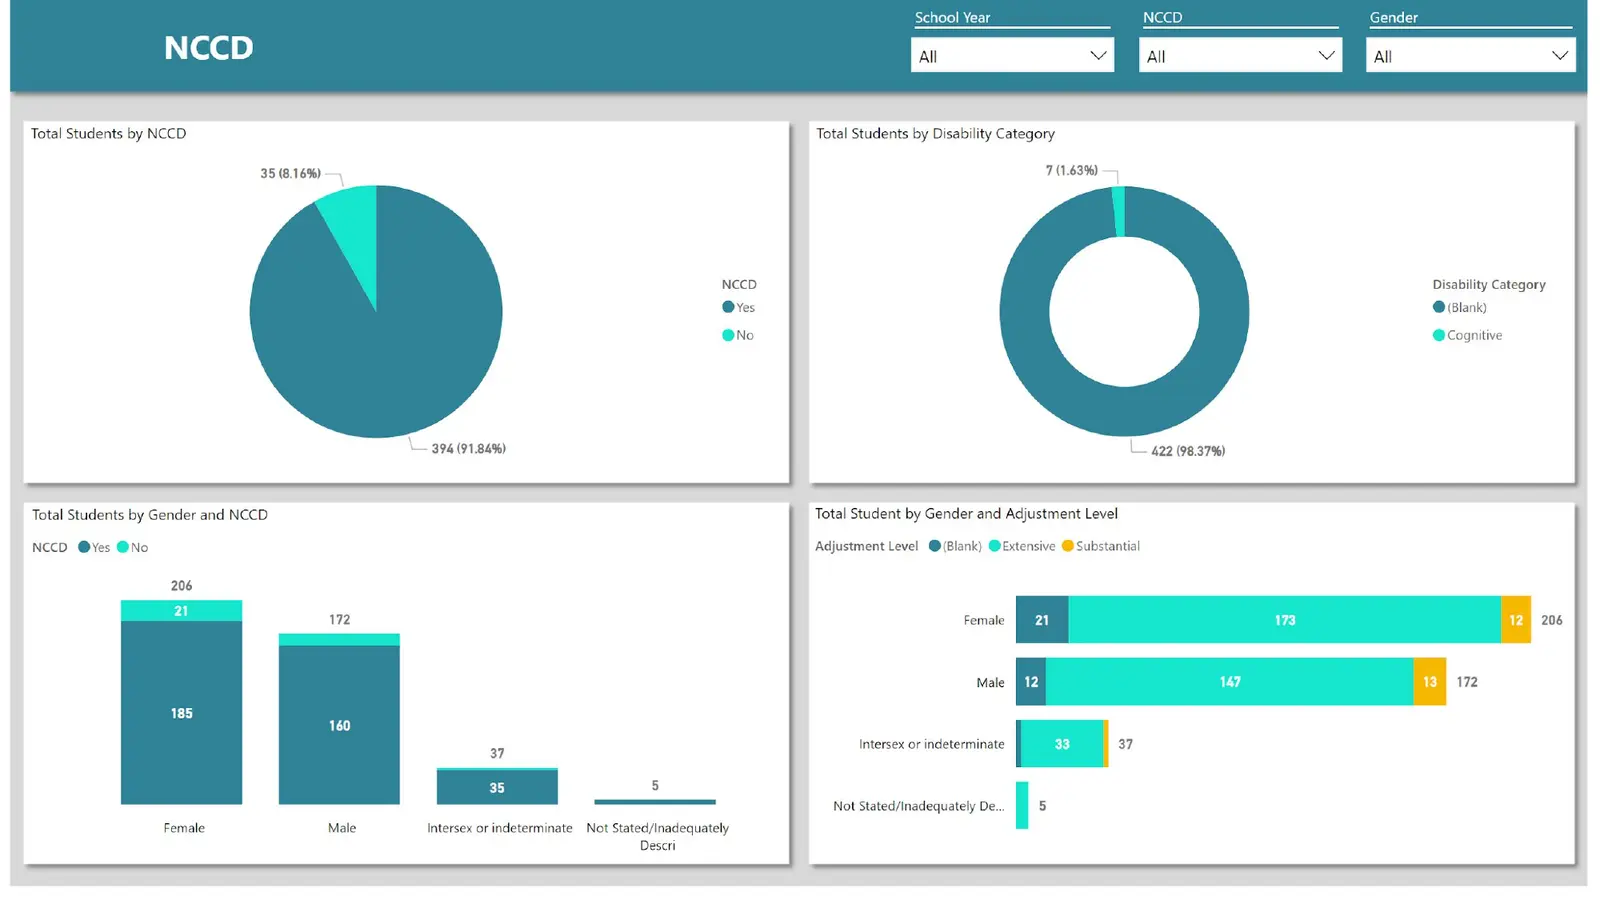
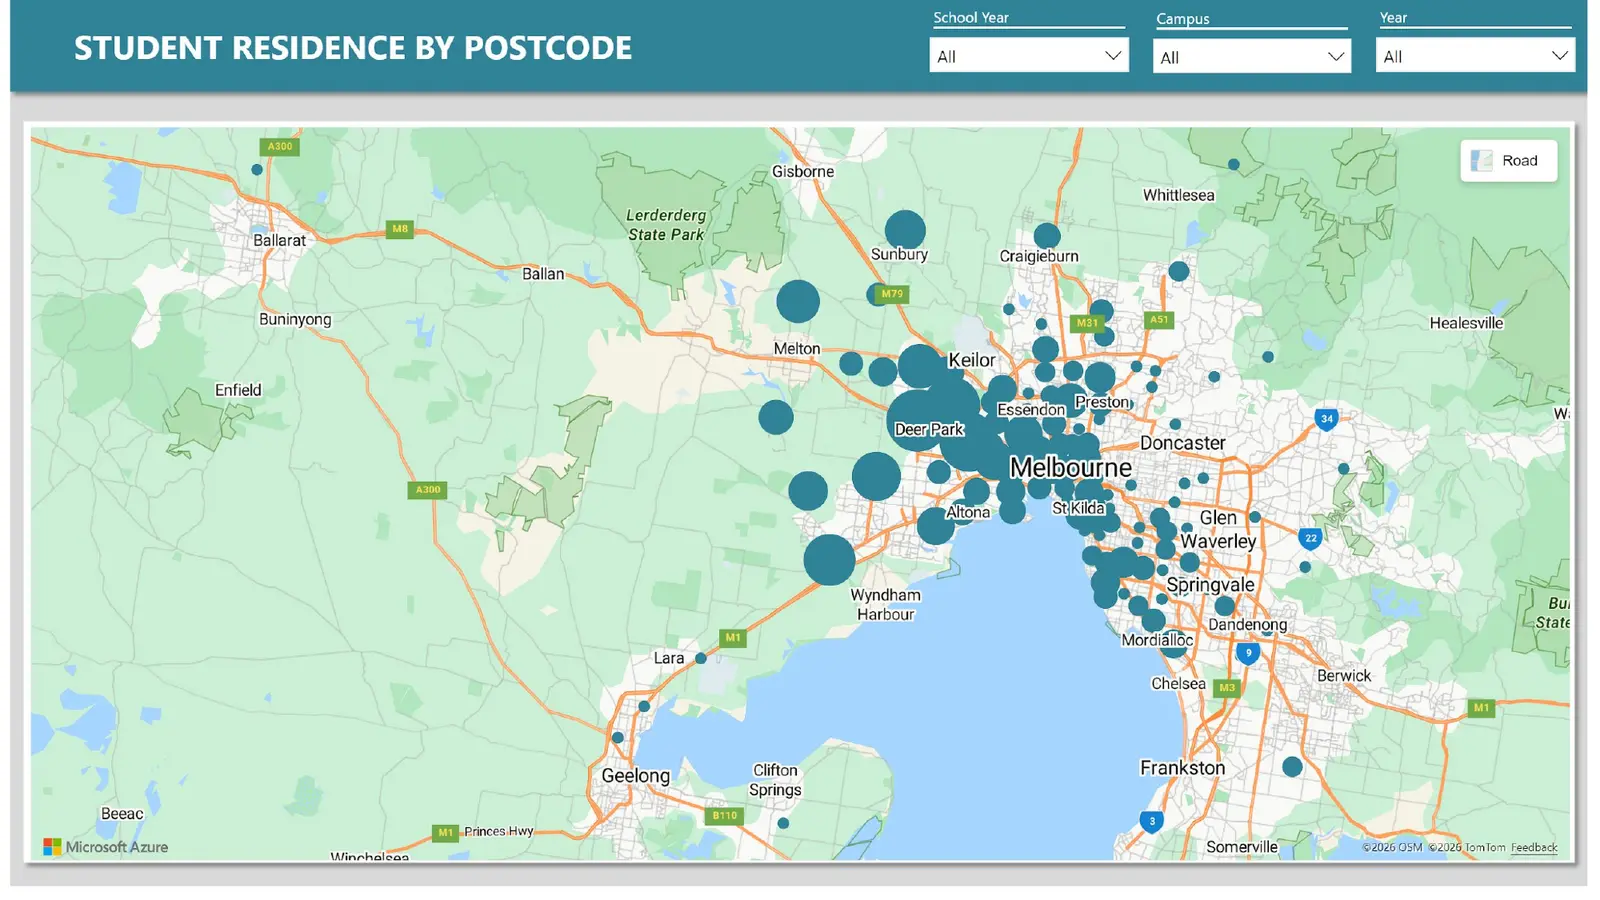
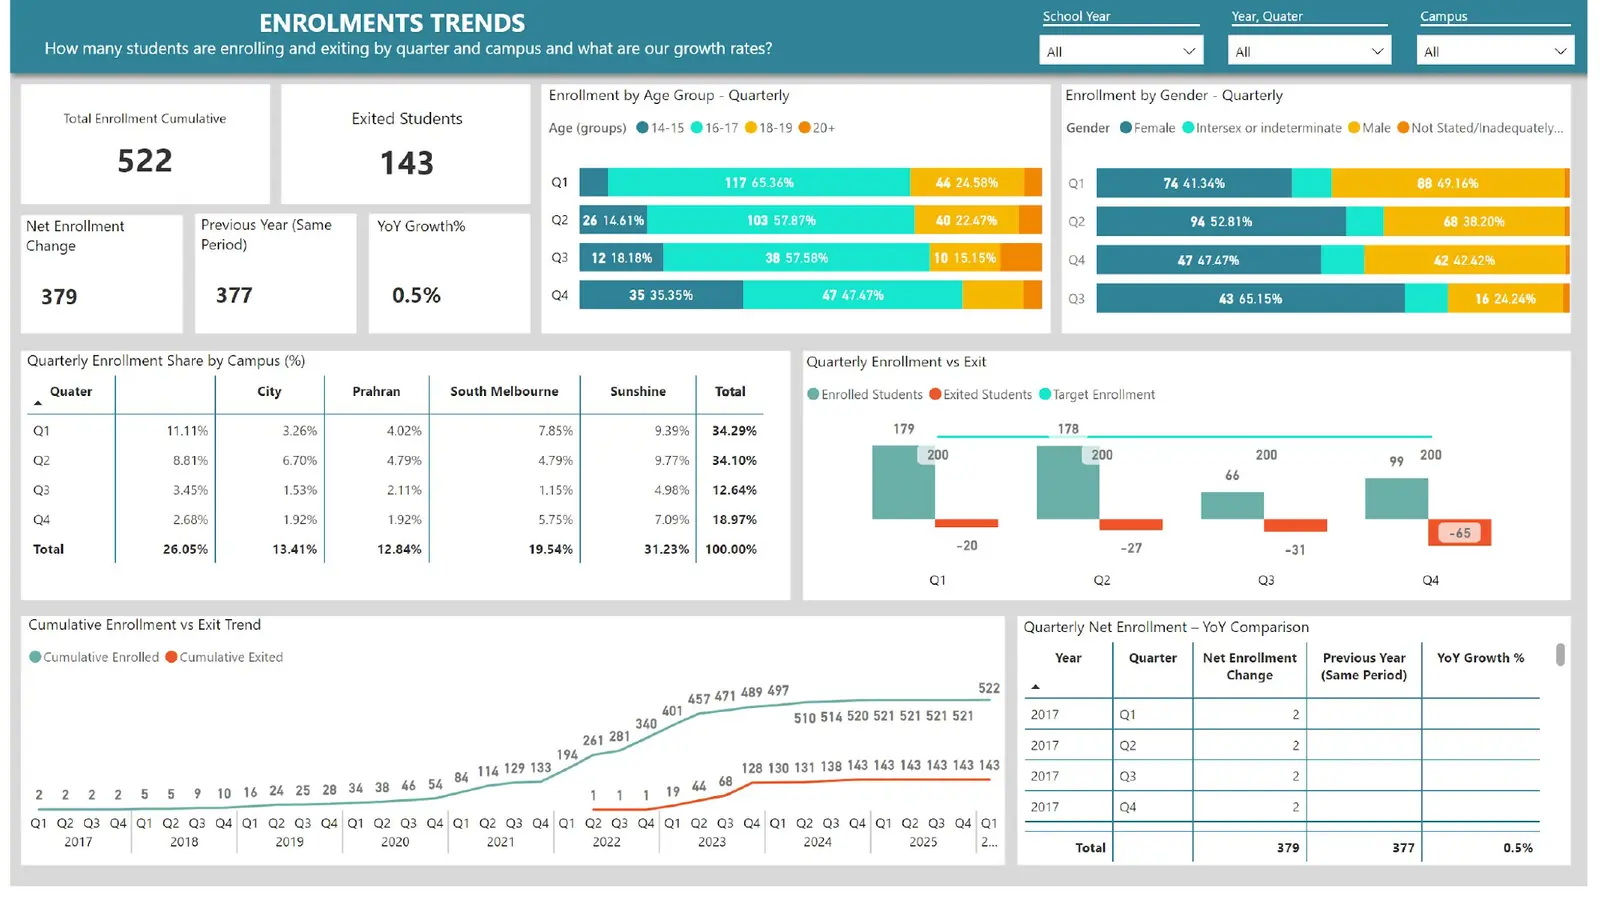
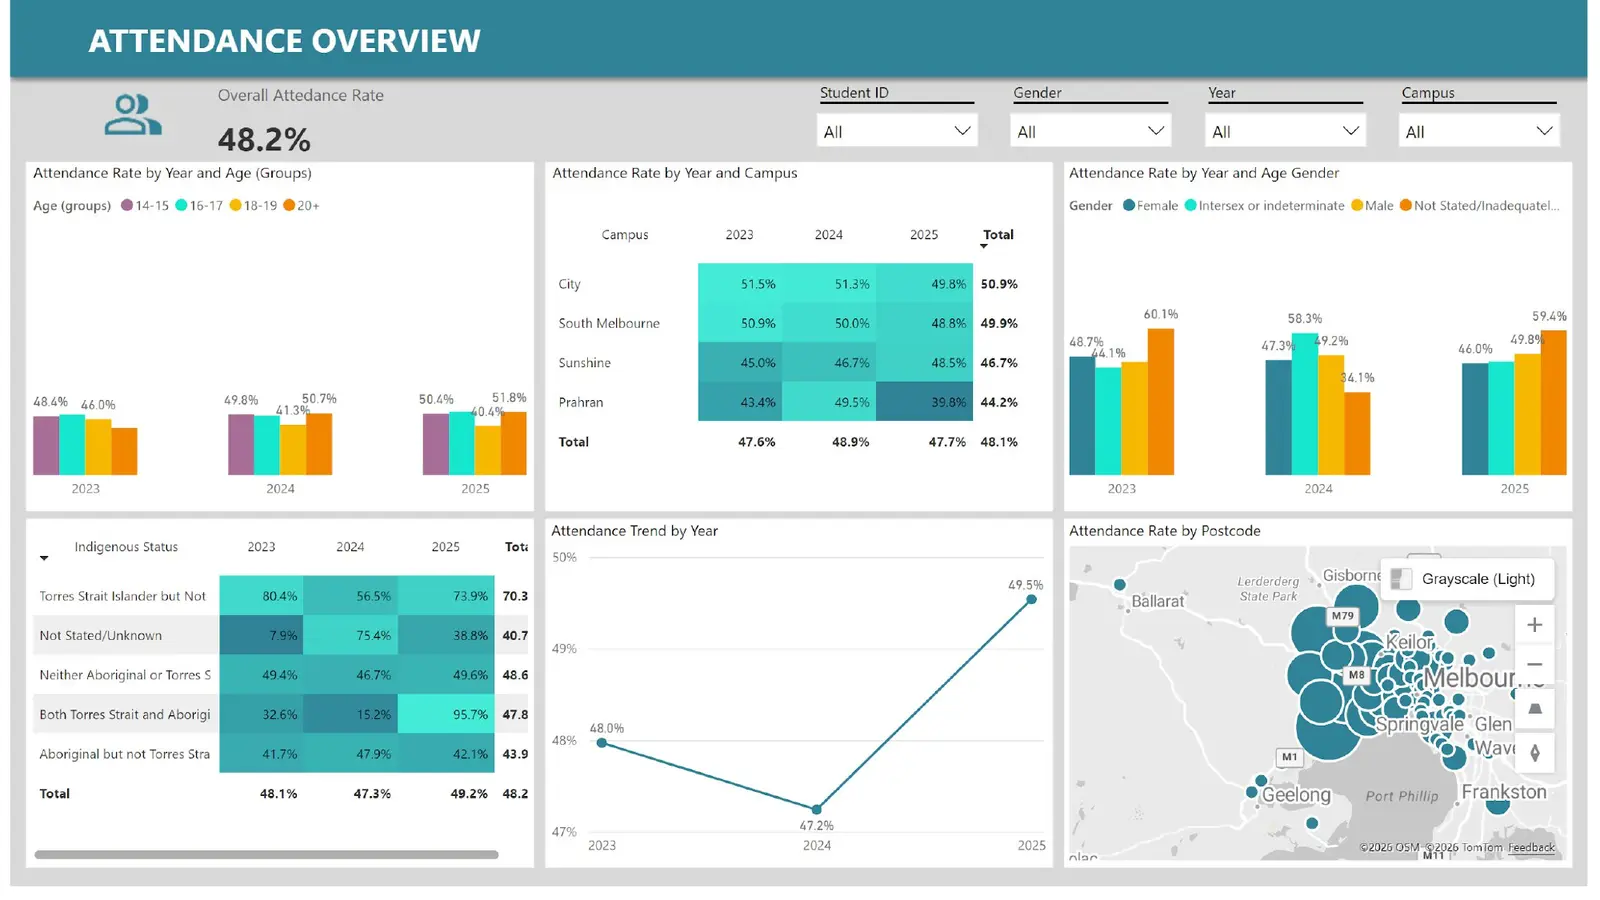
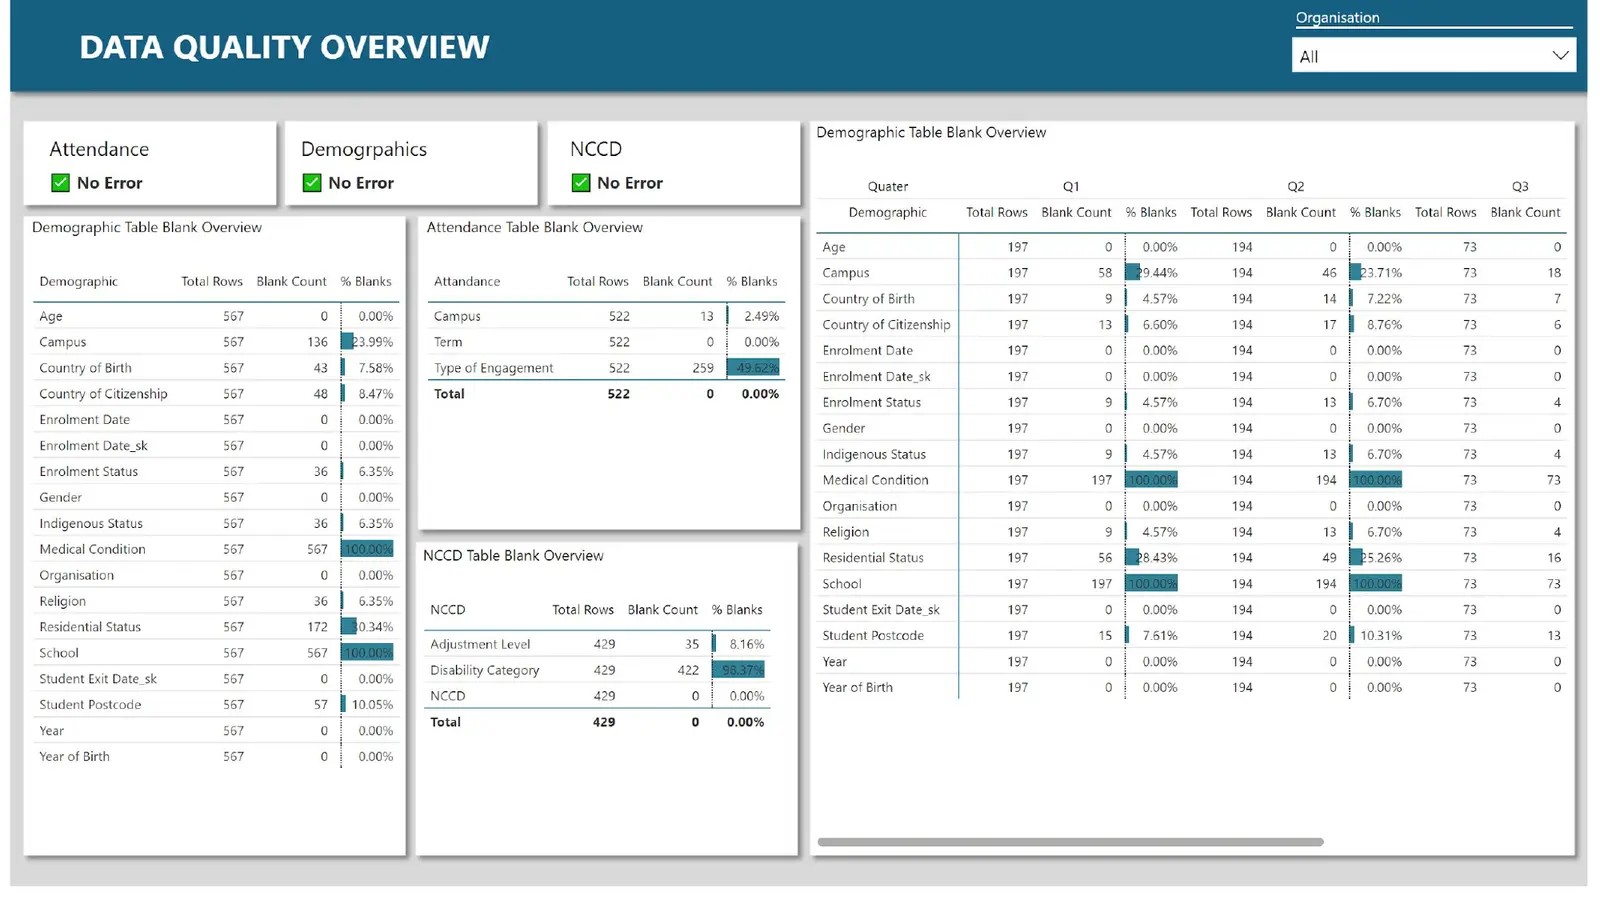
A four-campus school was running enrolment, attendance and disability-compliance reporting off disconnected exports — nobody could answer "how many students enrolled this quarter" without manually reconciling spreadsheets from each campus. We built a six-page Power BI suite on one shared data model: demographics, NCCD compliance, a live student-residence map, enrolment trends with year-over-year growth, attendance by campus and cohort, and — the page that changed how the data gets trusted — an automated Data Quality Overview that counts blank and missing fields per table on every refresh, so a bad data load gets caught before it reaches a report.
CAMPUSES
4Sunshine, South Melbourne, City, Prahran
REPORTS
6-page Power BI suite
COMPLIANCE
NCCD-ready reporting
DATA QUALITY
Automated blank-field checks
Real screens, not mockups
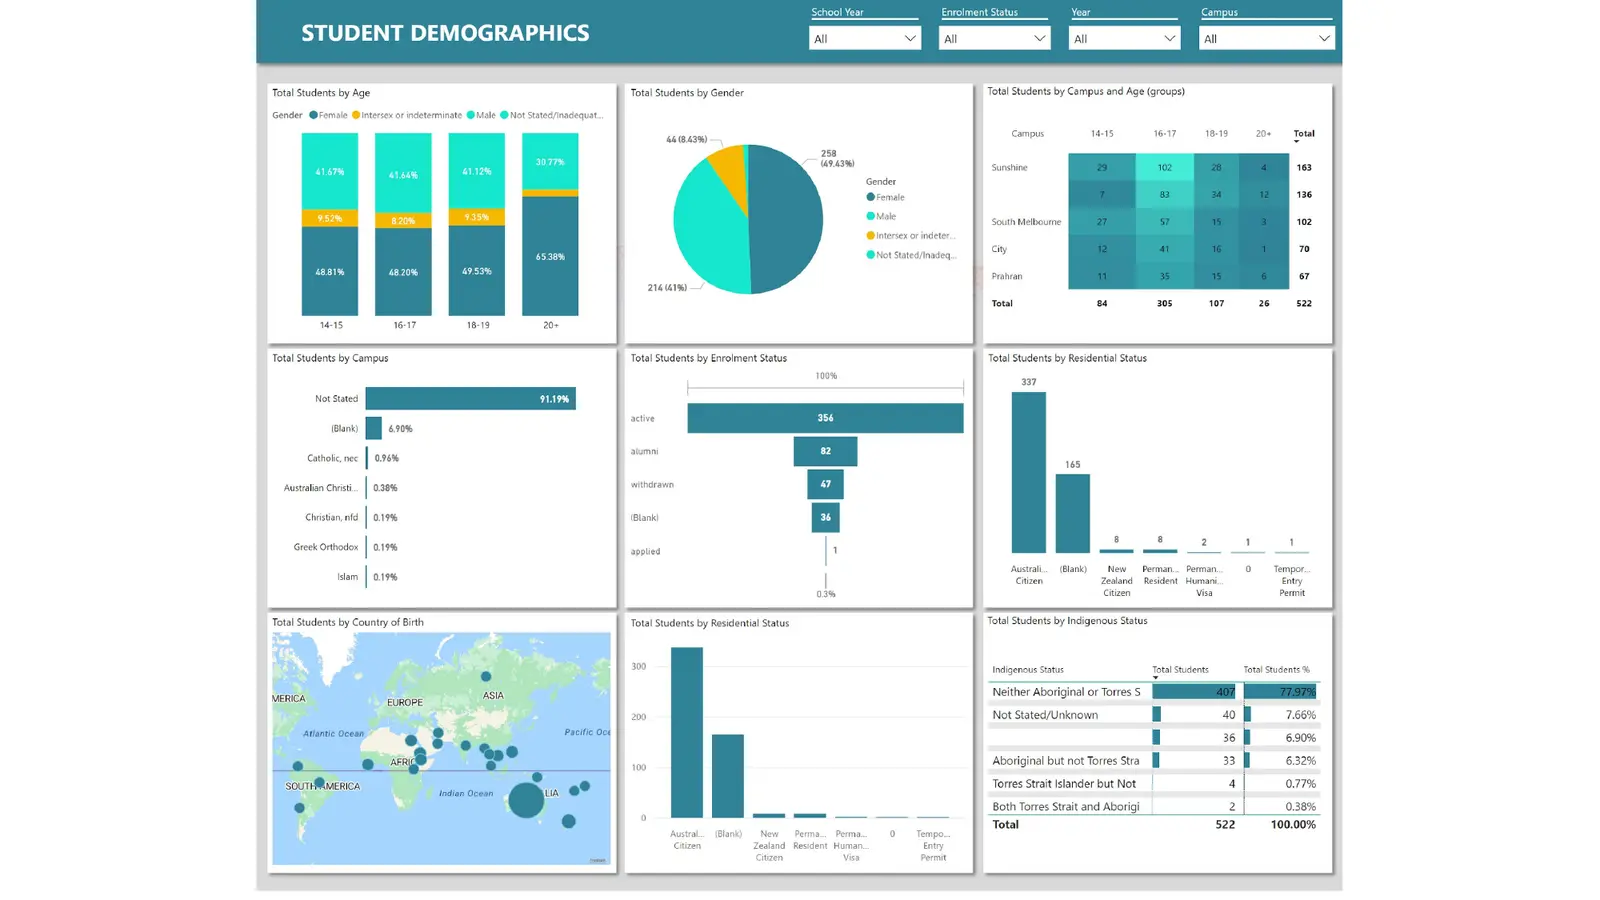
What the system does
Enrolment trends
Quarterly enrolment vs exit, net change and year-over-year growth, broken down by campus, age and gender.
NCCD compliance
Disability category and adjustment-level reporting built to the Nationally Consistent Collection of Data standard.
Attendance overview
Attendance rate sliced by year, campus, age, gender and postcode, with a three-year trend line.
Residence mapping
Every enrolled student's postcode plotted on a live map, sized by student count.
Data quality checks
An automated page that counts blank fields per table so staff catch a data problem before it reaches a report.
How it is put together
Source data
Student information system exports — enrolment, attendance, demographic and NCCD extracts
Modelling
Power Query transforms feeding a shared DAX star schema joining campus, term and student dimensions
Reporting
Six Power BI report pages with synced slicers for school year, campus and cohort
Governance
A dedicated data-quality page scoring blank and missing fields per table on every refresh
Stack
- Power BI
- Power Query
- DAX
- Azure Maps
Where it stands
- Coverage
- 522 students across 4 campuses in one model
- Compliance
- NCCD reporting built to the national standard
- Trust
- Staff catch data gaps before they reach a report, not after
Need a system like Student Insights Suite?
Tell us what you are trying to ship. The engineer who built this one answers.