
Local Shops Analytics
Live in productionUS · Seattle · Business Analytics
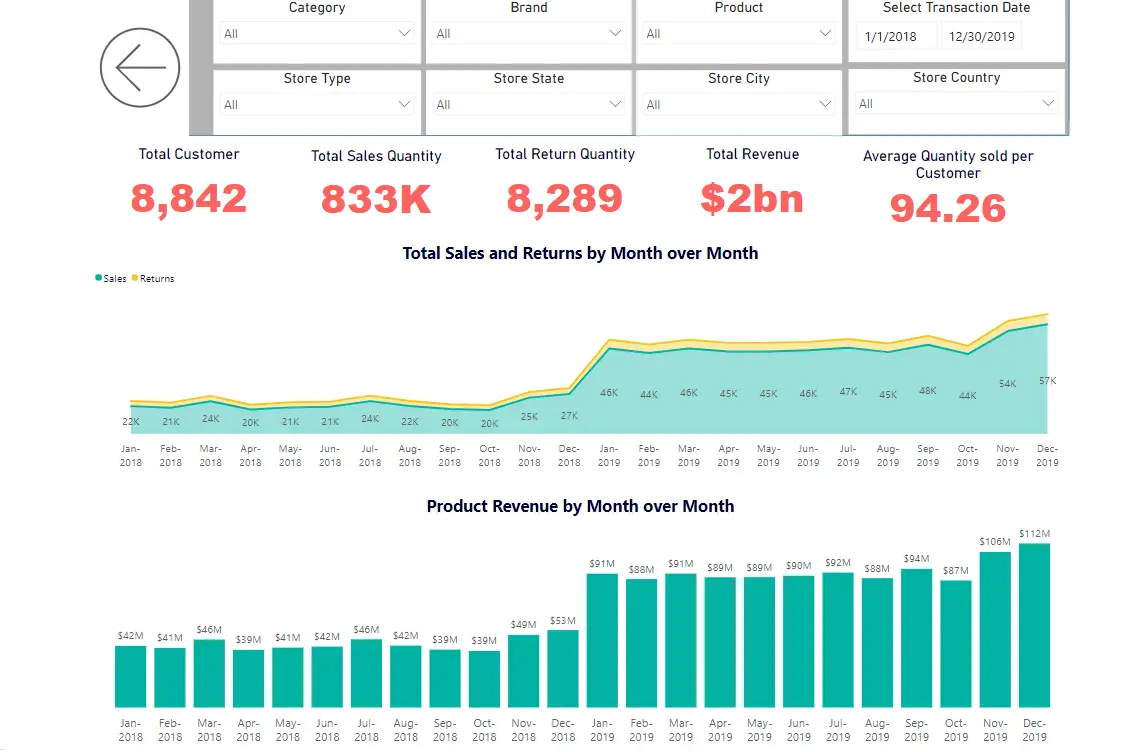
"Shop Local", a multi-state US grocery and local-shop retail network, had sales, returns and customer data scattered across store-level systems with no way to compare performance across stores, categories or customer segments — nobody could answer which store or product line was actually losing money without a manual pull per store. We built an Azure Data Factory + Azure Functions ETL pipeline that lands and transforms the data into Azure SQL Database on a schedule, then a Power BI suite on top — a Summary page, a Product Analysis drilldown, a Customer Analysis view, and a store-level map — so category managers and store ops can see revenue, returns and customer behaviour down to a single store and product.
ETL
Azure Data Factory + Azure Functions
WAREHOUSE
Azure SQL Database
REVENUE TRACKED
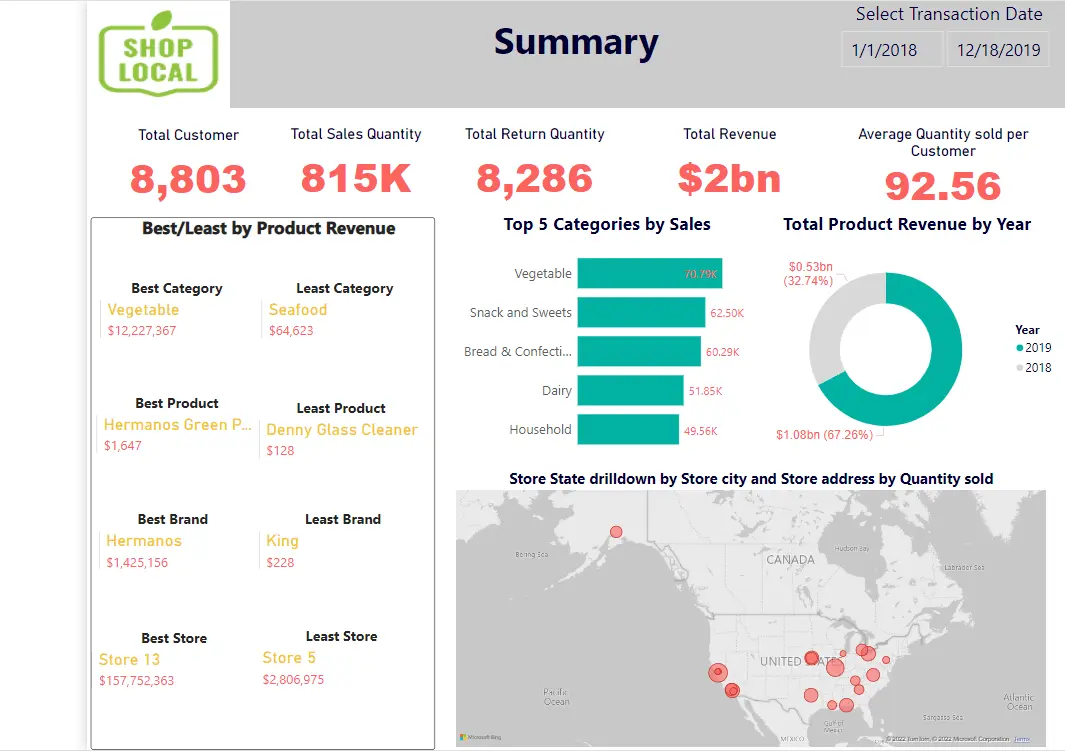
$2bnacross 8,803 customers
COVERAGE
Store-level drill-down, US-wide
Real screens, not mockups
What the system does
Automated ETL
Azure Data Factory pipelines trigger Azure Functions to clean and load store, product and transaction data into Azure SQL Database on a schedule — no manual exports.
Executive summary
Total revenue, sales quantity, returns and best/least performing category, product, brand and store in one page.
Product analysis
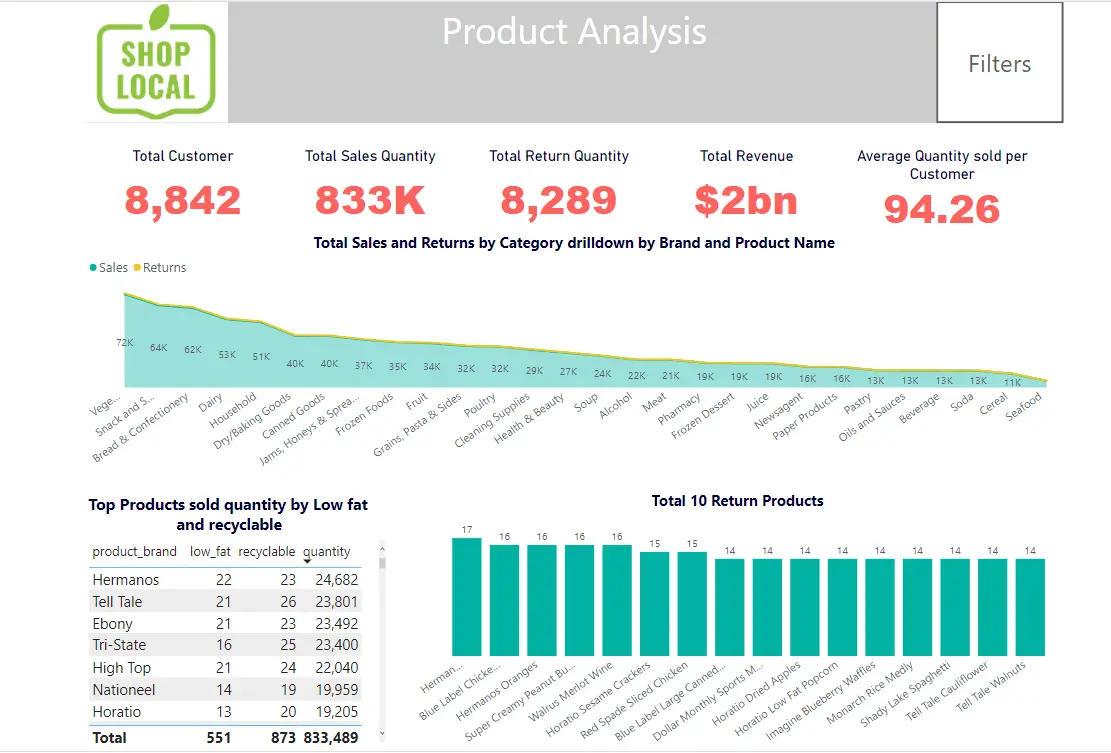
Sales and returns drilldown by category, brand and product, plus a low-fat/recyclable breakdown for compliance-minded buyers.
Customer analysis
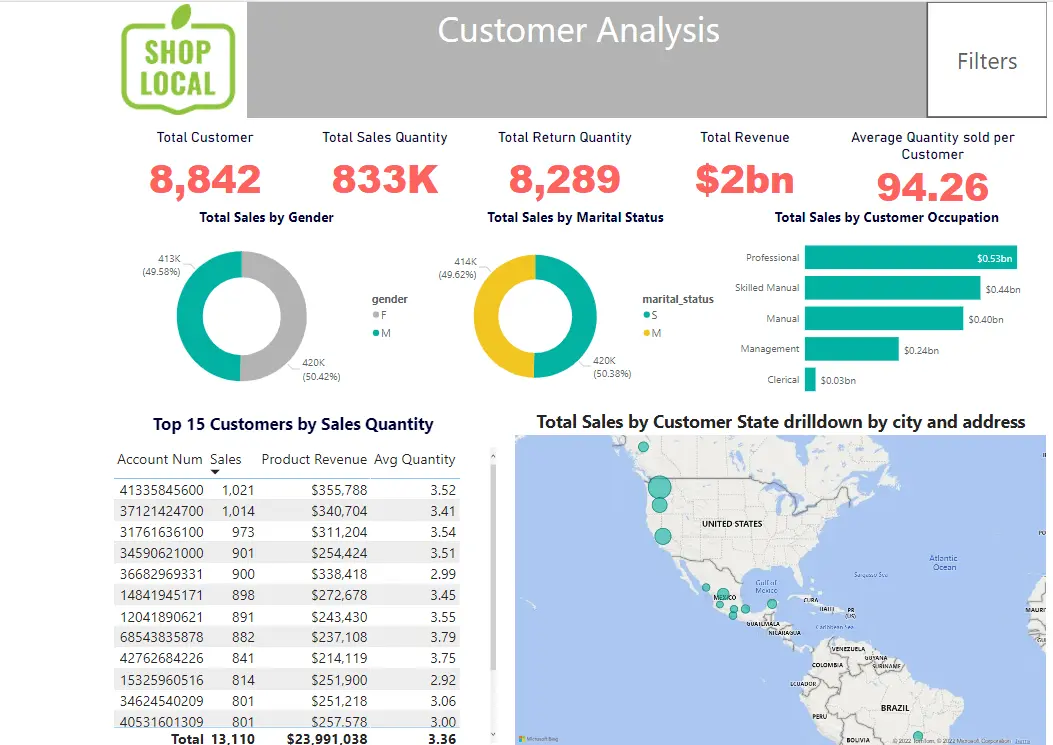
Revenue by gender, marital status and occupation, plus a top-15 customer leaderboard by sales quantity.
Store drill-down map
Every store plotted geographically, sized by quantity sold, drillable from state down to individual address.
How it is put together
Ingestion
Azure Data Factory pipelines pull raw store, product and transaction data on a schedule
Transform
Azure Functions clean, validate and reshape the data before load
Warehouse
Azure SQL Database holds the modelled star schema
Reporting
Power BI connects live to Azure SQL — Summary, Product Analysis and Customer Analysis pages
Stack
- Azure Data Factory
- Azure Functions
- Azure SQL Database
- Power BI
Where it stands
- Pipeline
- Fully automated Azure Data Factory + Functions ETL — no manual data pulls
- Scale
- $2bn in tracked revenue across 8,803 customers and 815K units sold
- Granularity
- Store-level drill-down from national total to a single address
Need a system like Local Shops Analytics?
Tell us what you are trying to ship. The engineer who built this one answers.