
Data and analytics
One numberthe whole room trusts
Power BI reporting and the pipelines underneath it, so sales, operations and finance stop reconciling four spreadsheets and start arguing about the decision instead of the data.
500+
Projects delivered
most under NDA
100+
Clients served
BR · AU · IN · US · EU
20
Systems live
in production now
0
Account managers
you talk to the engineer
What we build
The work itself,component by component
Report and dashboard design
The page set, the drill path, and what a reader should be able to answer within ten seconds of opening it.
Semantic models and DAX
Every measure defined once, so Total Sales means the same thing in every panel and every meeting.
ETL pipelines
Scheduled Azure Data Factory jobs that land clean, typed data instead of somebody re-exporting a CSV on Monday.
Source integrations
Salesforce, the ERP, the school MIS, the point of sale: read at the source rather than through an export.
Data quality checks
Rows that fail validation surface inside the report, not silently inside an average.
Handover and training
The people who read the report can add a measure and publish it without opening a ticket.
Why it matters
What changesonce it is running
Three things a buyer of this work should be able to hold us to.
One version of the number: Sales, operations and finance open the same report on the same definitions, so the meeting starts at the decision.
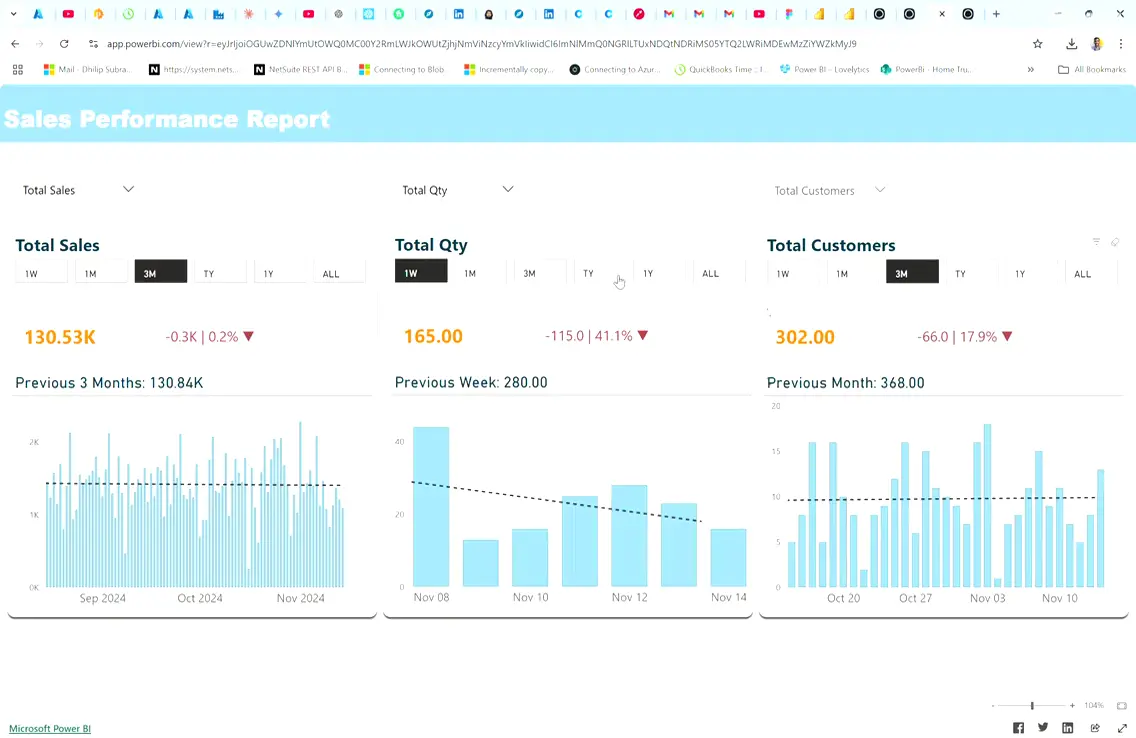
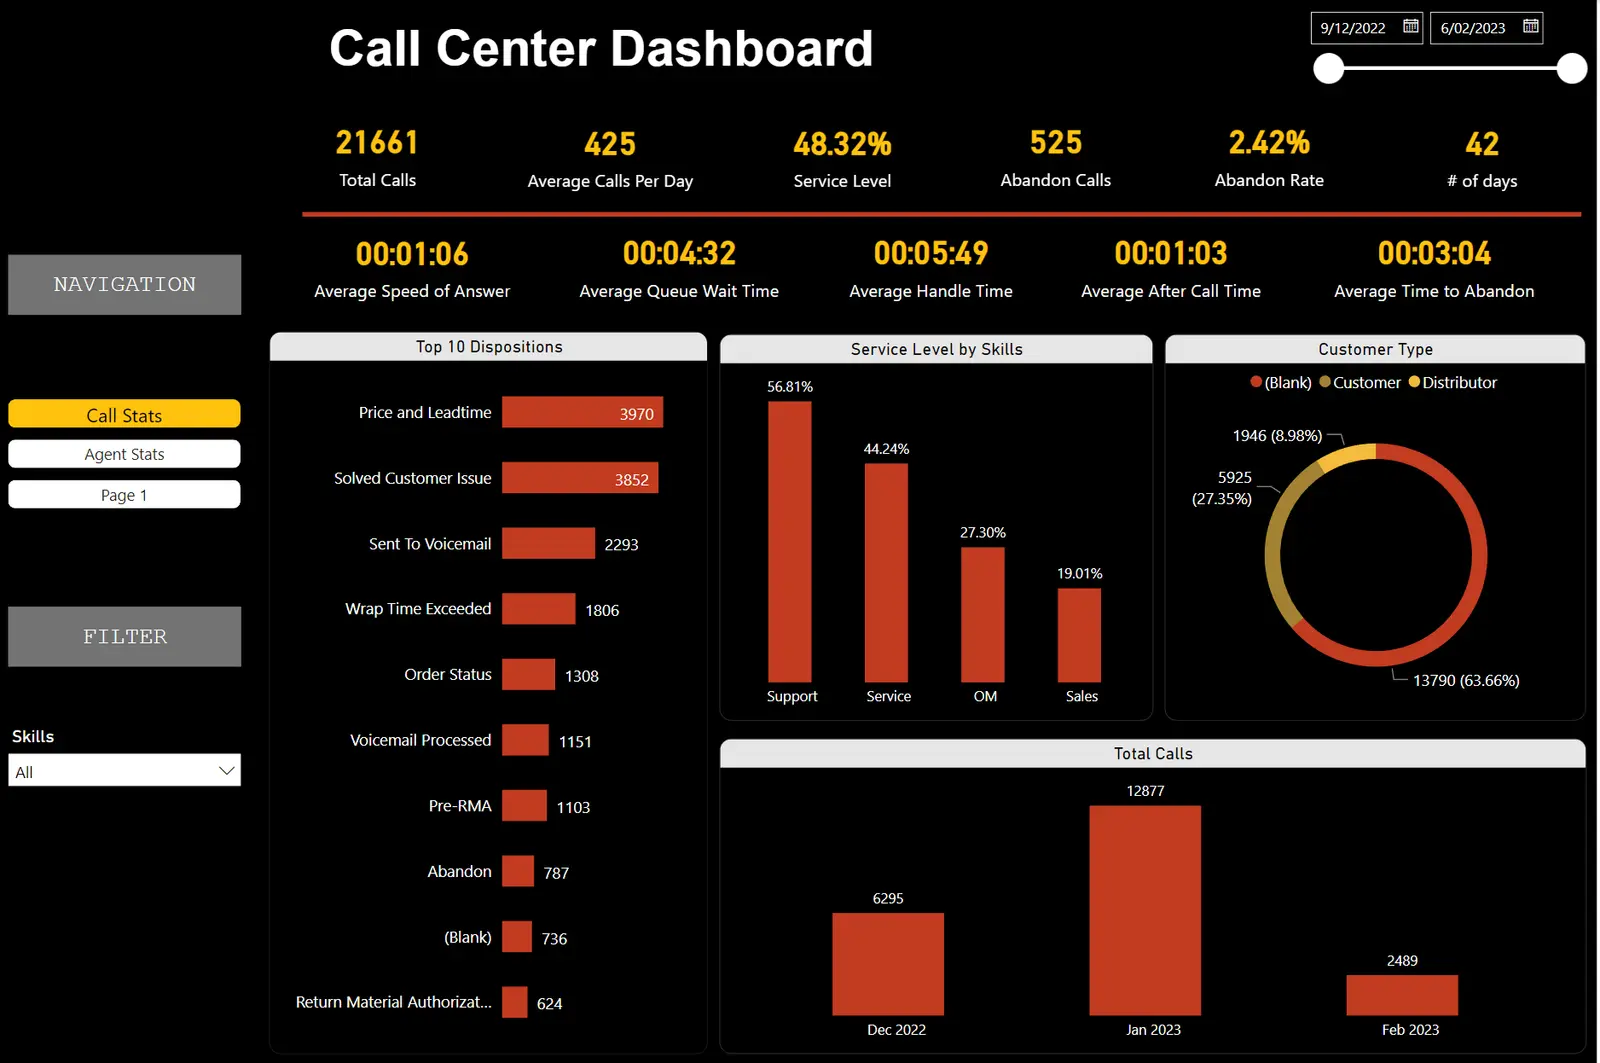
You see it while it matters: Service level, attendance, stock movement: measured on a rolling window, so a bad day is visible while it is still happening.
The pipeline is yours: It runs in your Microsoft tenant under your licences, documented well enough that another team could pick it up.
Stack we use for this
- Power BI
- DAX
- Power Query
- Azure Data Factory
- Azure SQL Database
- Salesforce
How it runs
Four stages,and you can leave after any of them
Scope
We agree what the system does and what shipping means, in writing.
Build
Short cycles in your repository, running before it is finished.
Ship
Deployed into your cloud account, reachable by a real user.
Stay
Maintenance and roadmap by the same engineers who built it.
Proof
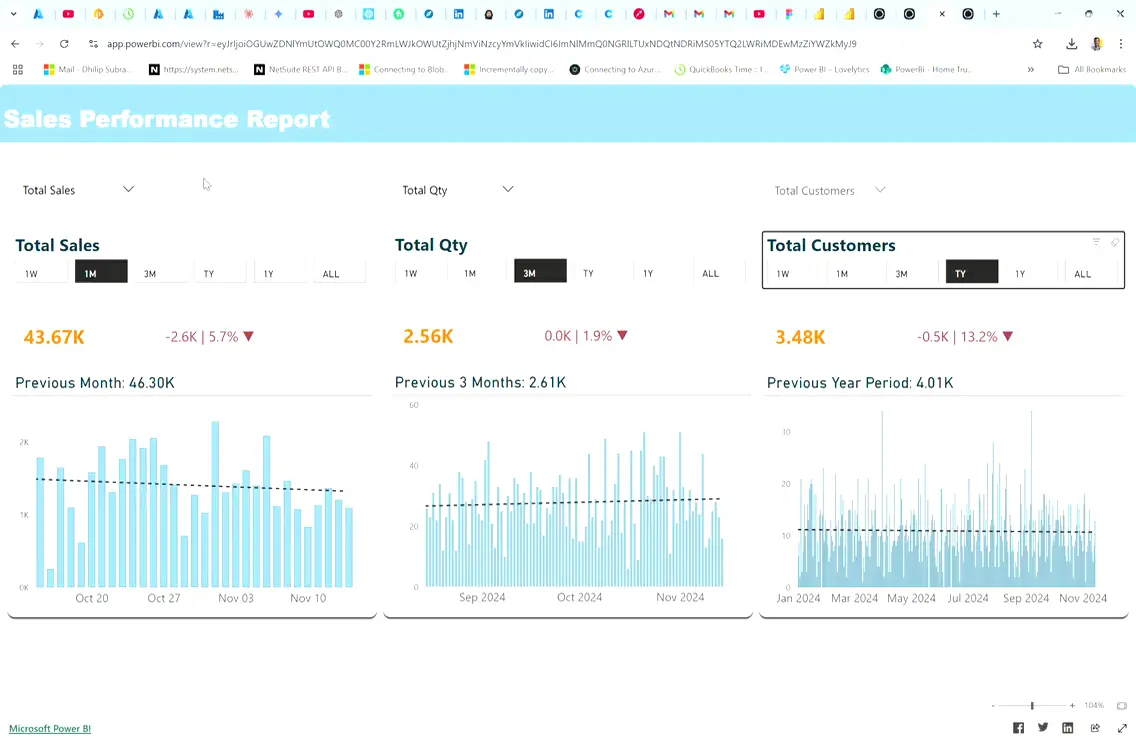
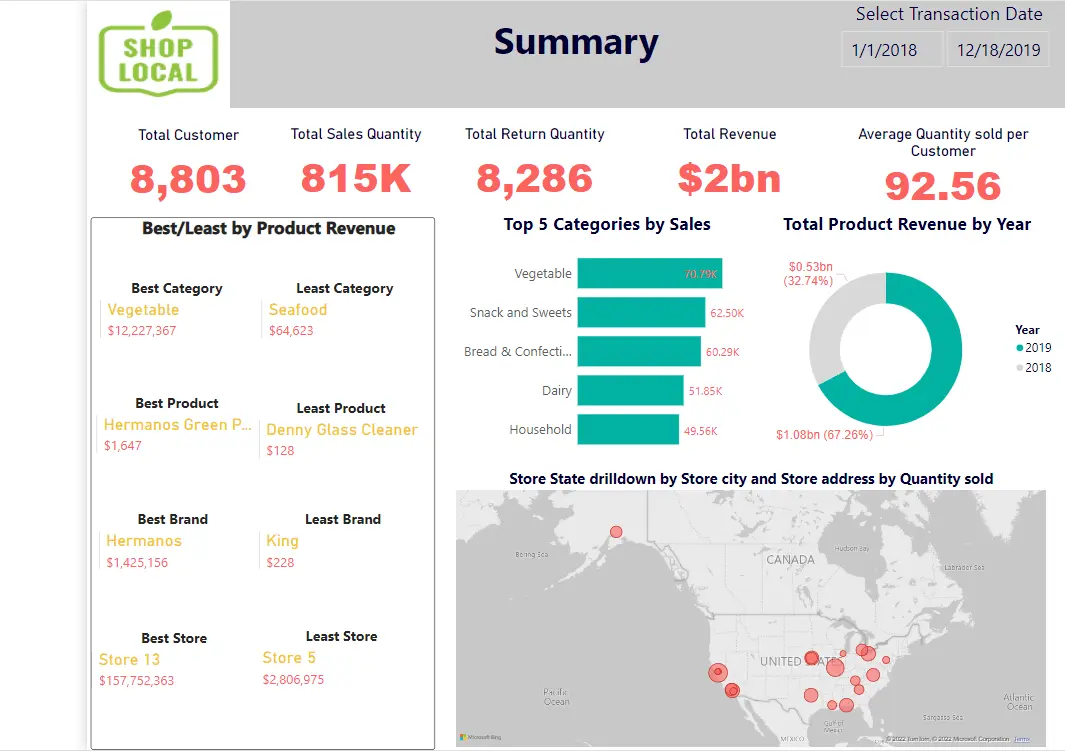
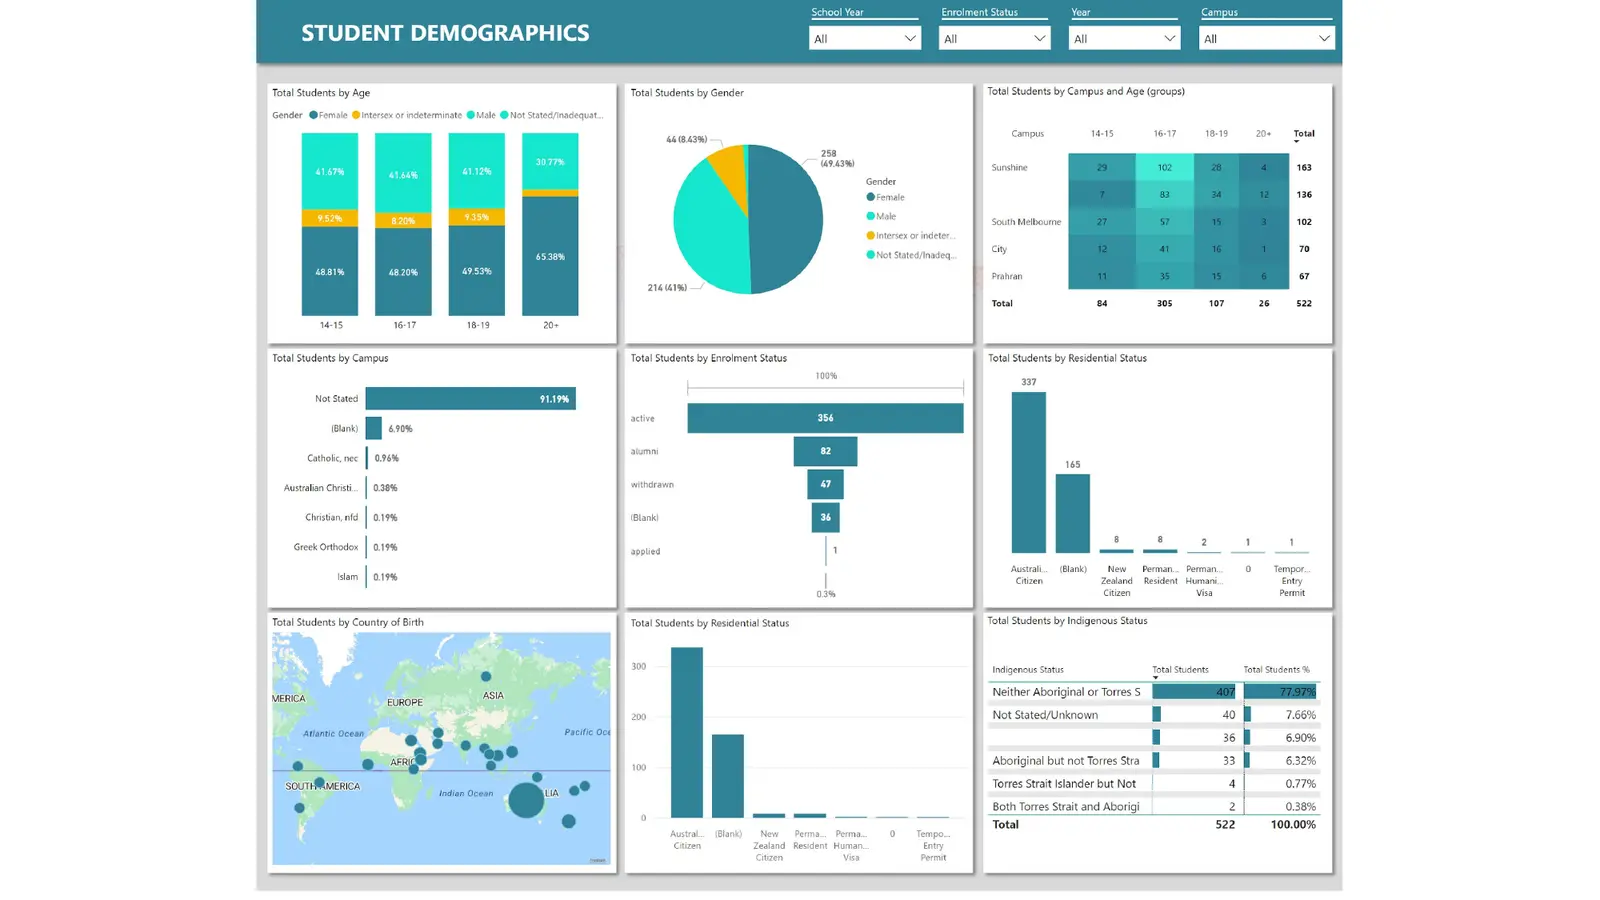
The systemsthat back this page
FAQ
Questionswe get asked
Do we need a data warehouse first?
Not always. Two of the four systems on this page read their sources directly. We build a warehouse when the history, the volume, or the number of sources makes it cheaper than not having one, and we tell you which case you are in before you spend anything.
Can you work with the Power BI we already have?
Yes, and it is where most of this work starts: reports that exist but nobody trusts. We usually rebuild the semantic model underneath before touching a single visual, because that is where the mismatched numbers come from.
Who owns the workspace and the data?
You do. It runs in your Microsoft tenant under your licences, and the model documentation is handed over with it rather than living in our heads.
How long before we see something?
A working report in weeks, not quarters. An early version exists so you can argue with it, which is faster than specifying it in the abstract.
Will our team be able to maintain it?
That is part of the deliverable. Measures are named and documented, and handover training sits in the estimate rather than arriving as an extra.
Is it only Power BI?
Power BI is what these four systems are built in, so it is what we can prove. If your stack points somewhere else we will say so plainly rather than learning it on your budget.
Data and analytics