
Sales Performance Report
Live in productionUS · Chicago · Business Analytics
Sales, ops and finance each pulled their own spreadsheet export to check sales, order quantity and customer counts — and every export used a different date range, so the numbers never quite matched by the time everyone sat down in the same meeting. We built a single interactive Power BI report with three independently swappable KPI panels: any panel can show Total Sales, Total Qty or Total Customers, each with its own time-range toggle from one week to all-time, its own prior-period comparison, and its own trend line. Two people can now look at the exact same report and compare different metrics across different windows without either of them touching a spreadsheet.
KPI PANELS
3 independently swappable
TIME RANGES
1 week to all-time, per panel
COMPARISON
Automatic prior-period delta
REFRESH
Scheduled Power BI dataset refresh
Real screens, not mockups
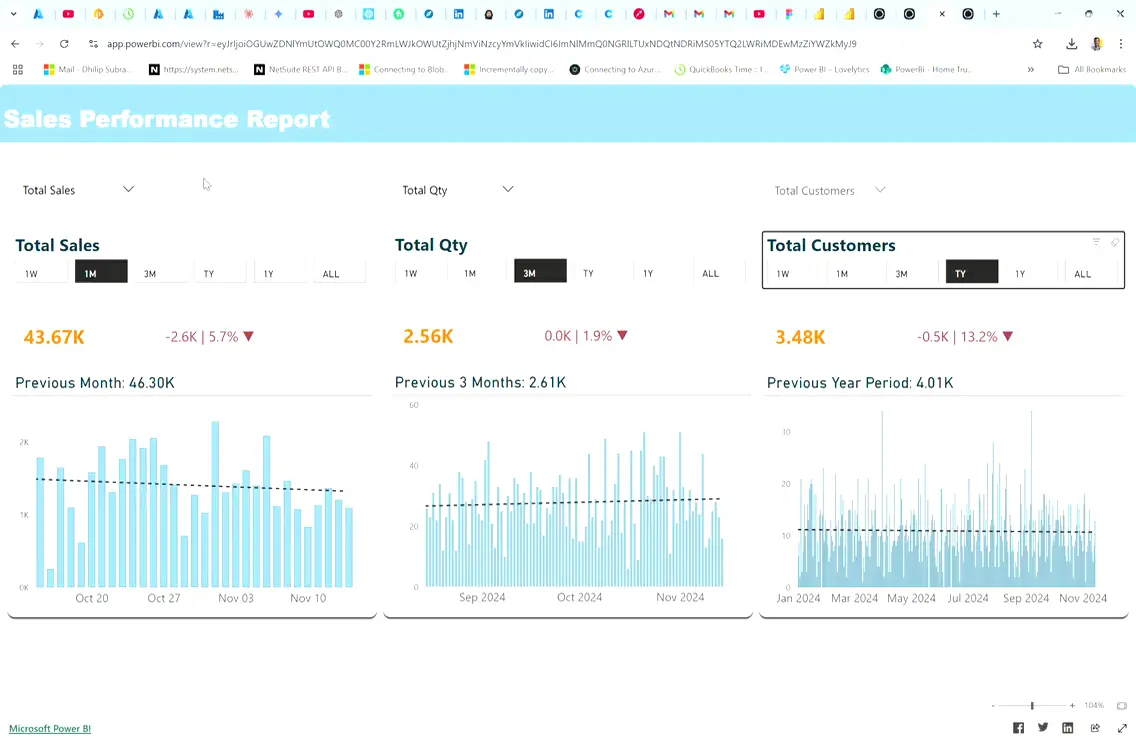
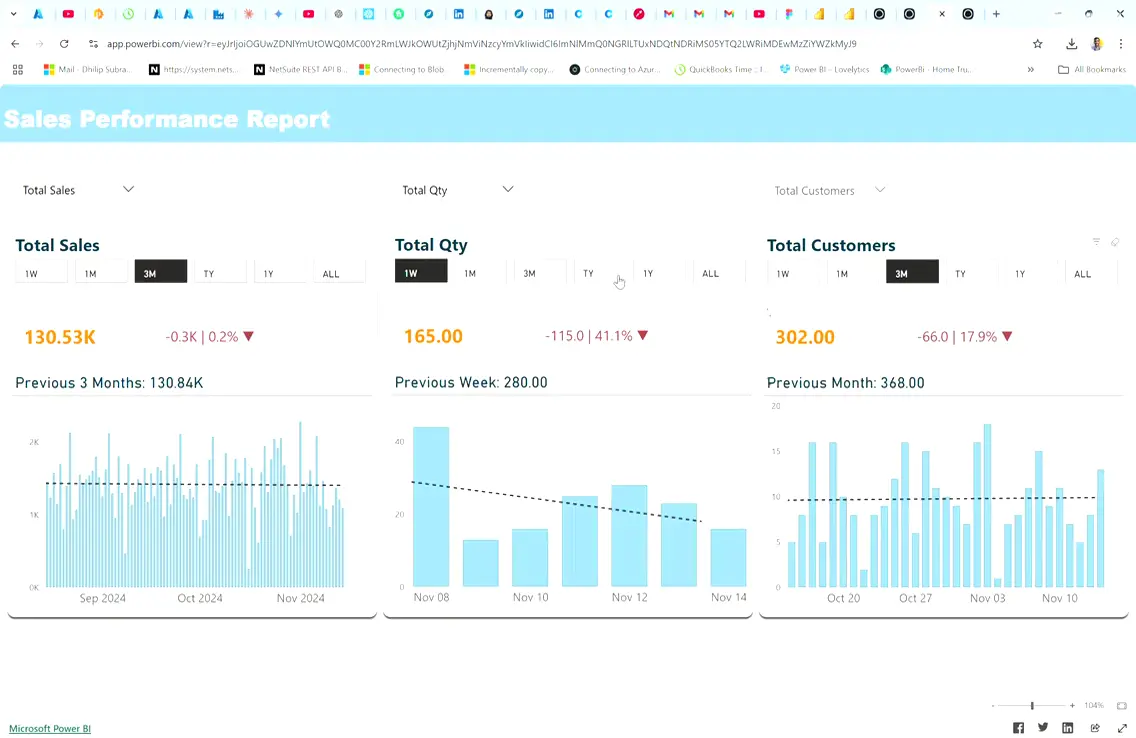
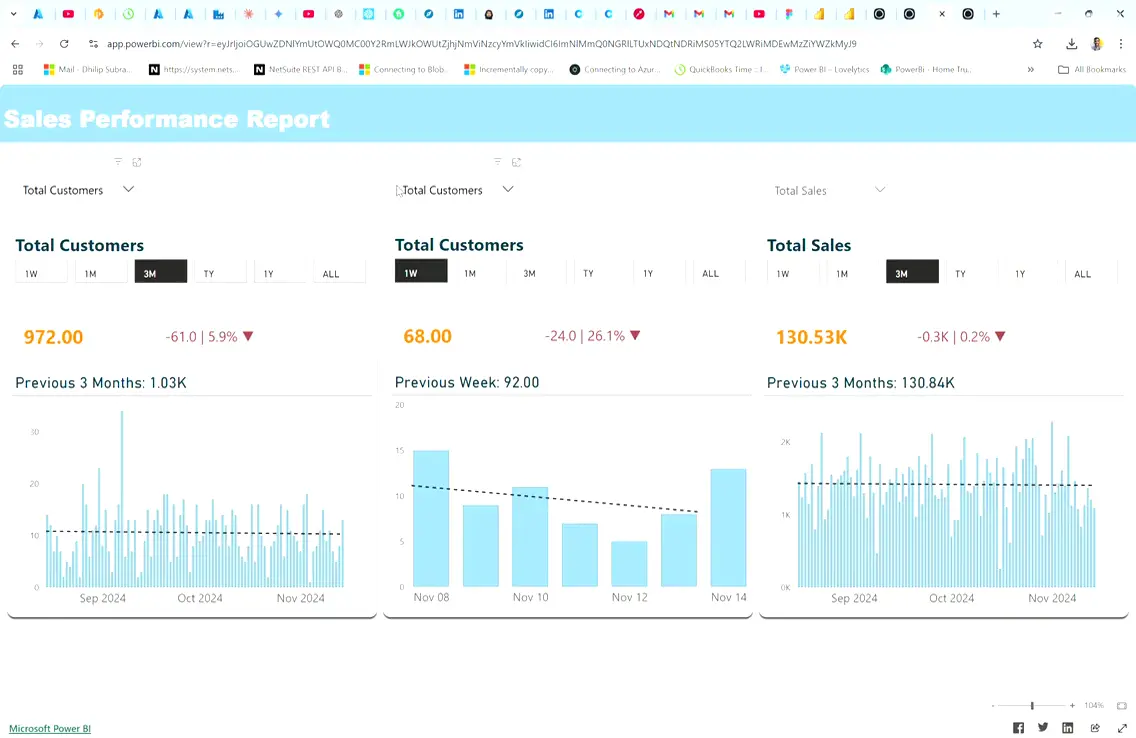
What the system does
Swappable KPIs
Each panel's dropdown swaps between Total Sales, Total Qty and Total Customers — no separate report needed per metric.
Independent time windows
Every panel toggles its own range — 1 week to all-time — so two metrics can be compared across different periods at once.
Prior-period deltas
Every number ships with its change versus the previous period, in both absolute and percentage terms.
Trend sparkline
A trend line with moving average sits under every panel so a spike reads as signal or noise at a glance.
How it is put together
Data source
Client's transactional sales records, refreshed on a scheduled Power BI dataset refresh
Modelling
Power Query transforms feeding a DAX measure library shared across all three panels
Report
A single interactive Power BI page — synced slicers, independent per-panel time intelligence
Stack
- Power BI
- DAX
- Power Query
Where it stands
- Before
- Separate spreadsheet exports per team, per metric, per time window
- After
- One shared report — every team looks at the same numbers
- Format
- Live Power BI report, walked through on video
Need a system like Sales Performance Report?
Tell us what you are trying to ship. The engineer who built this one answers.