
Call Centre Dashboard
Live in productionUS · Denver · Business Analytics
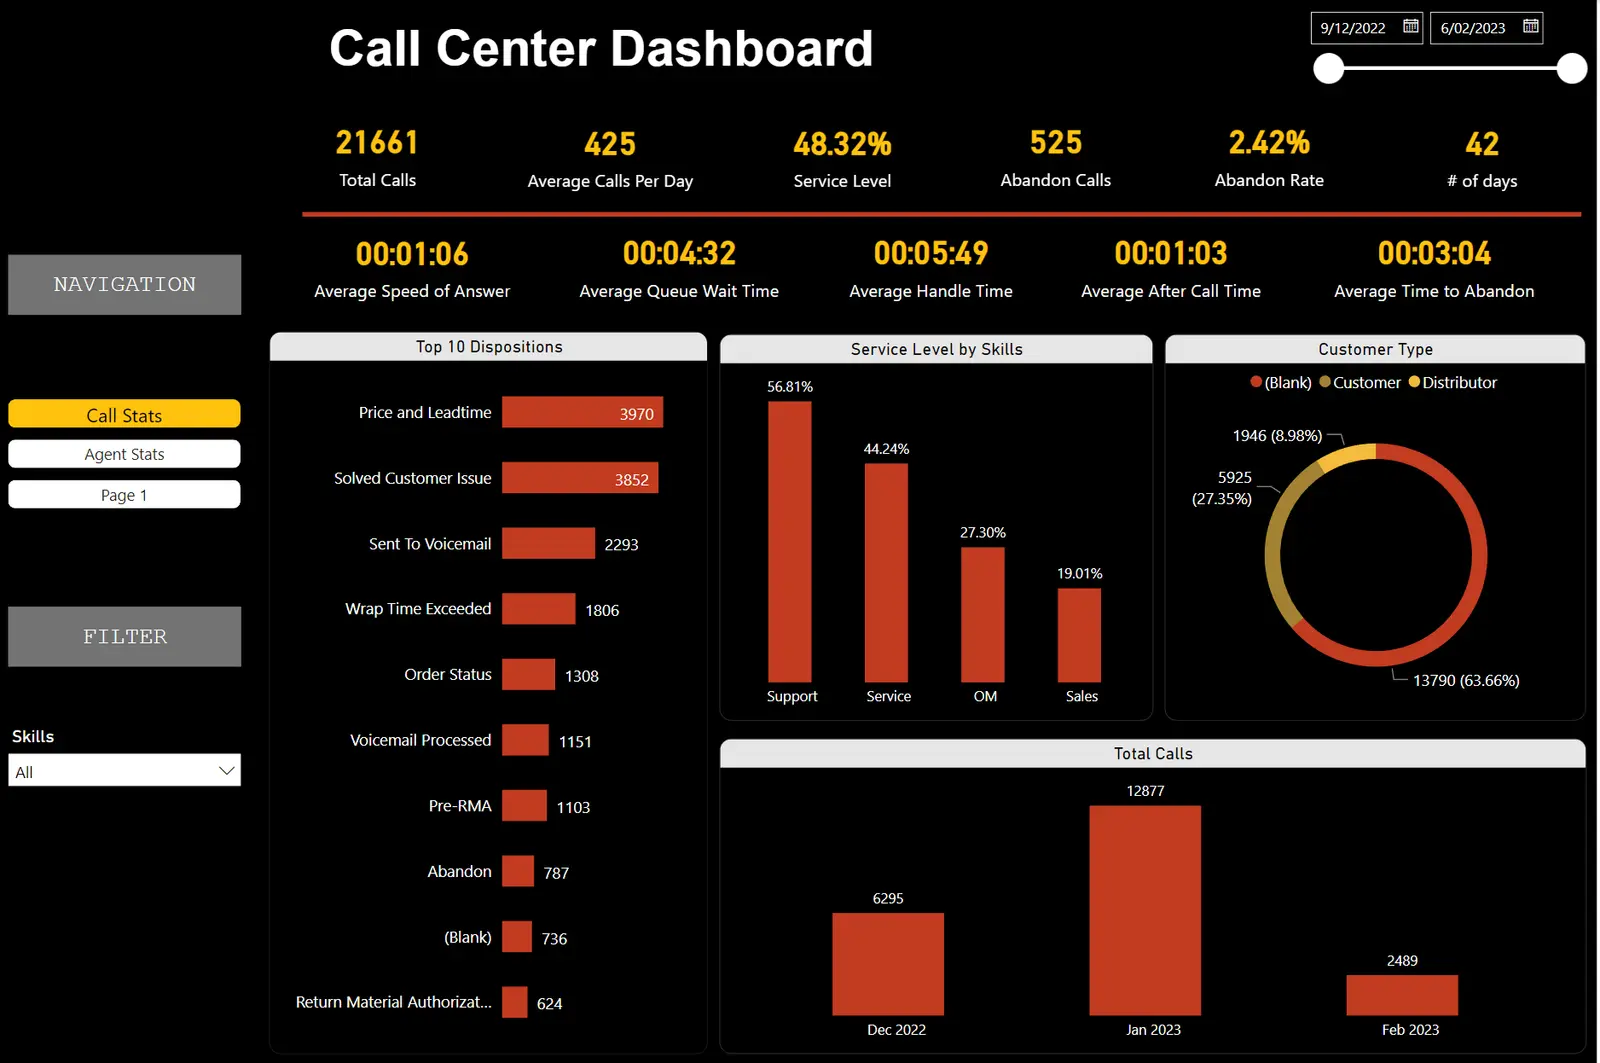
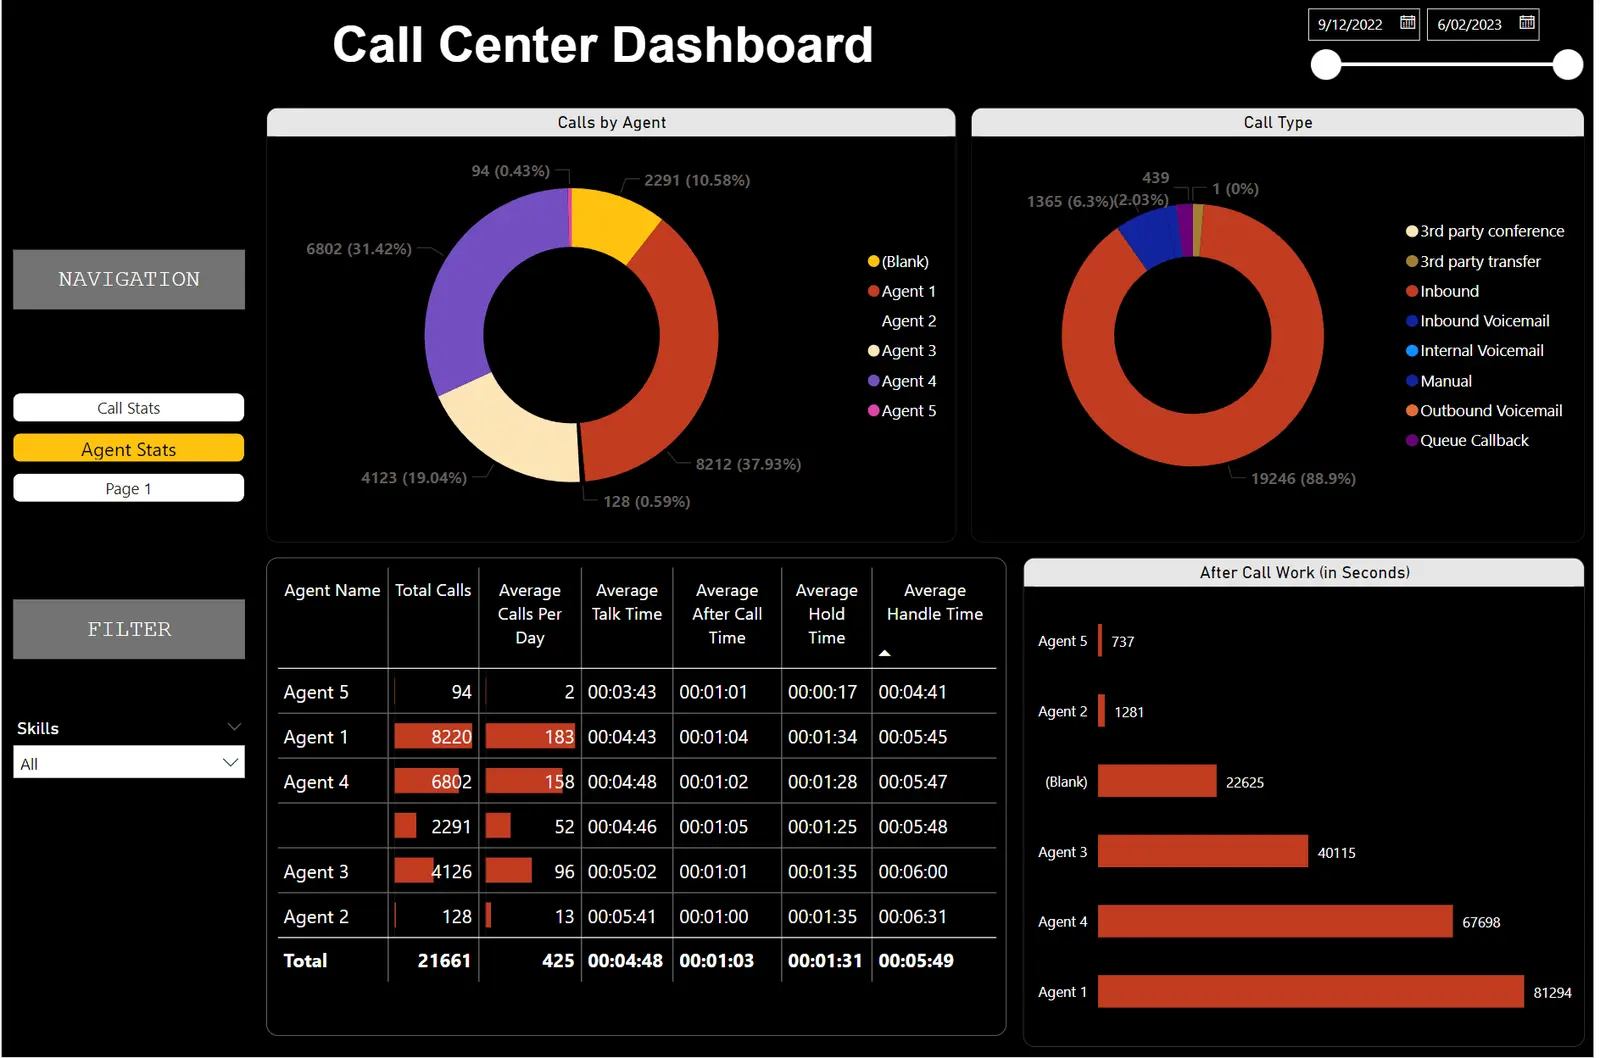
Call centre leadership only found out about a bad service day — a blown service level, a spike in abandoned calls — after the fact, buried in a Salesforce case report built for support tickets, not call operations. We built a two-page Power BI dashboard fed directly by Salesforce call data: a Call Stats page tracking service level, abandon rate and handle time against a rolling date range, and an Agent Stats page breaking every metric down per agent. A team lead can now see who needs coaching before the queue backs up, not after month-end.
CALLS TRACKED
21,661across 42 days
SOURCE
Salesforce Service Cloud
SERVICE LEVEL
48.32% live
AGENTS
Per-agent scorecards
Real screens, not mockups
What the system does
Service-level tracking
Service level, abandon rate and abandon count tracked against a rolling date range, not a monthly export.
Disposition breakdown
Top 10 call dispositions ranked by volume, so recurring issues surface without a manual tally.
Skill-level service
Service level broken out by skill queue — Support, Service, OM, Sales — so a bottleneck in one queue doesn't hide behind a blended average.
Per-agent scorecards
Talk time, hold time, after-call work and handle time per agent, sortable, for one-on-one coaching conversations.
How it is put together
Source
Salesforce Service Cloud call and case objects
Modelling
Power Query pulls call, agent and disposition tables into a shared DAX model
Reporting
Two synced Power BI pages — Call Stats and Agent Stats — filterable by skill and date range
Stack
- Power BI
- Salesforce
- DAX
Where it stands
- Visibility
- Service level and abandon rate visible same-day, not after month-end
- Coaching
- Per-agent handle time and after-call work make coaching conversations specific
- Source
- Built directly on Salesforce — no separate call-logging system
Need a system like Call Centre Dashboard?
Tell us what you are trying to ship. The engineer who built this one answers.